Summary of Milestone Time from Simulated Trials
Source:R/summarizeMilestoneTime.R
summarizeMilestoneTime.RdSummary of Milestone Time from Simulated Trials
Arguments
- output
a data frame. It assumes that triggering time of milestones are store in columns
milestone_time_<...>. It can be a data frame returned bycontroller$get_output(), or row-binded from multiple data frames returned bycontroller$get_output()(e.g., users may run simulation under thetargetsframework).
Examples
# a minimum, meaningful, and executable example,
# where a randomized trial with two arms is simulated and analyzed.
control <- arm(name = 'control arm')
active <- arm(name = 'active arm')
pfs_in_control <- endpoint(name = 'PFS', type = 'tte', generator = rexp, rate = log(2) / 5)
control$add_endpoints(pfs_in_control)
pfs_in_active <- endpoint(name = 'PFS', type = 'tte', generator = rexp, rate = log(2) / 6)
active$add_endpoints(pfs_in_active)
accrual_rate <- data.frame(end_time = c(10, Inf), piecewise_rate = c(30, 50))
trial <- trial(name = 'trial',
n_patients = 1000,
duration = 40,
enroller = StaggeredRecruiter,
accrual_rate = accrual_rate,
dropout = rweibull, shape = 2, scale = 38,
silent = TRUE)
trial$add_arms(sample_ratio = c(1, 1), control, active)
action_at_final <- function(trial){
locked_data <- trial$get_locked_data('final analysis')
fitLogrank(Surv(PFS, PFS_event) ~ arm, placebo = 'control arm',
data = locked_data, alternative = 'less')
invisible(NULL)
}
final <- milestone(name = 'final analysis',
action = action_at_final,
when = eventNumber(endpoint = 'PFS', n = 300))
listener <- listener(silent = TRUE)
listener$add_milestones(final)
controller <- controller(trial, listener)
controller$run(n = 10, plot_event = FALSE, silent = TRUE)
output <- controller$get_output()
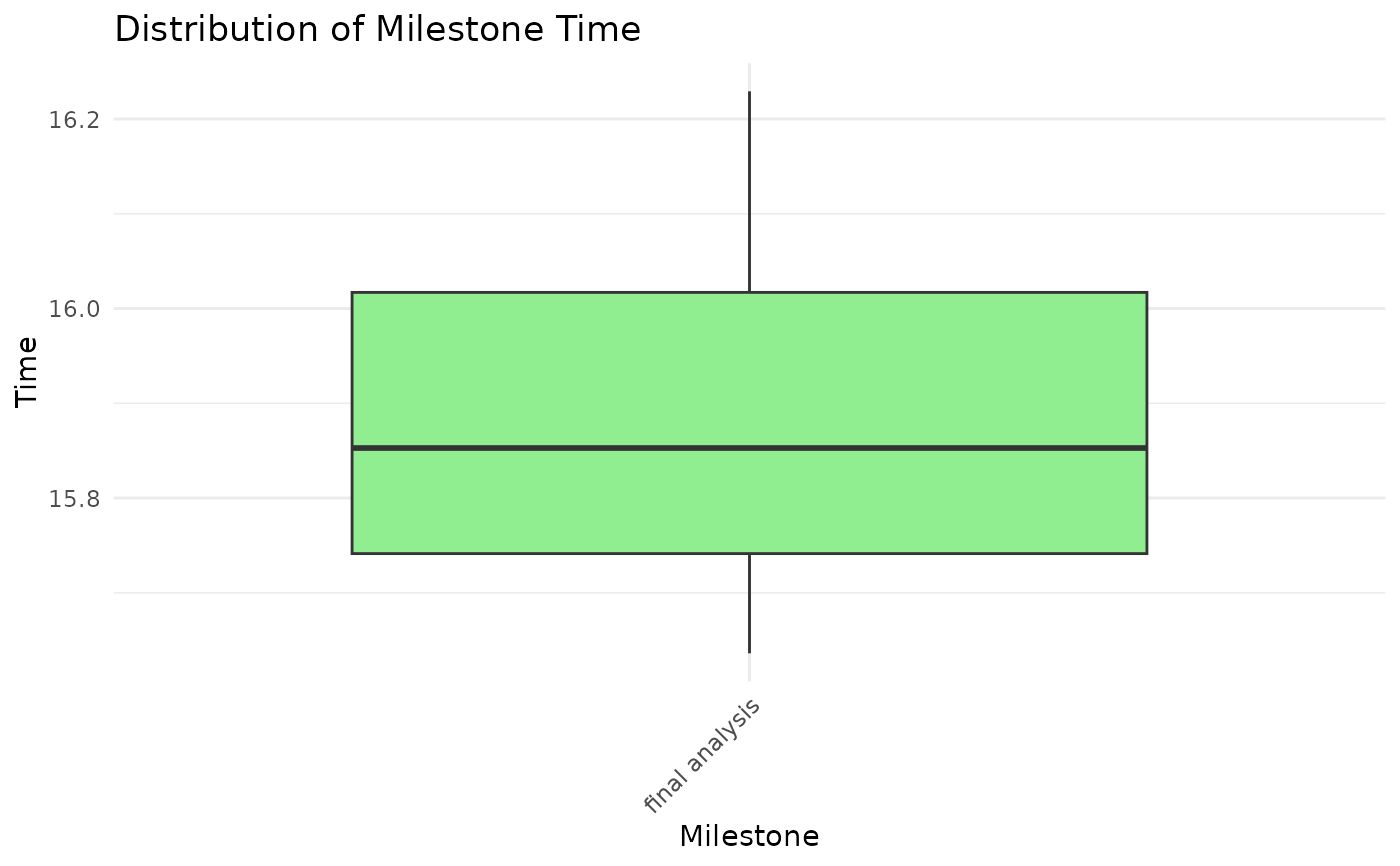
time <- summarizeMilestoneTime(output)
time
#> milestone mean median sd n
#> 1 final analysis 15.79077 15.80381 0.3210882 10
plot(time)